
Nicole Glass Photography // Shutterstock
Renter nation: America’s fastest-growing rental markets
America’s renter story isn’t simply about 20-somethings delaying homeownership. Renter-occupied units are exploding in unlikely places, and they’re increasingly occupied by a group you might not expect.
MoveBuddha compared renter-occupied units across the U.S. from 2019 to 2024 to identify where new units were added fastest.
Here’s the key: Occupied rental units aren’t springing up in cities that are adding population with the same percentage growth. They’re exploding in locales that stand a chance of getting swept up into high regional growth and in spots that already have economies built on transient jobs. Further, these newly occupied rental units aren’t just getting leased by new grads or visiting professors; they’re often occupied by retirees.
Key Takeaways
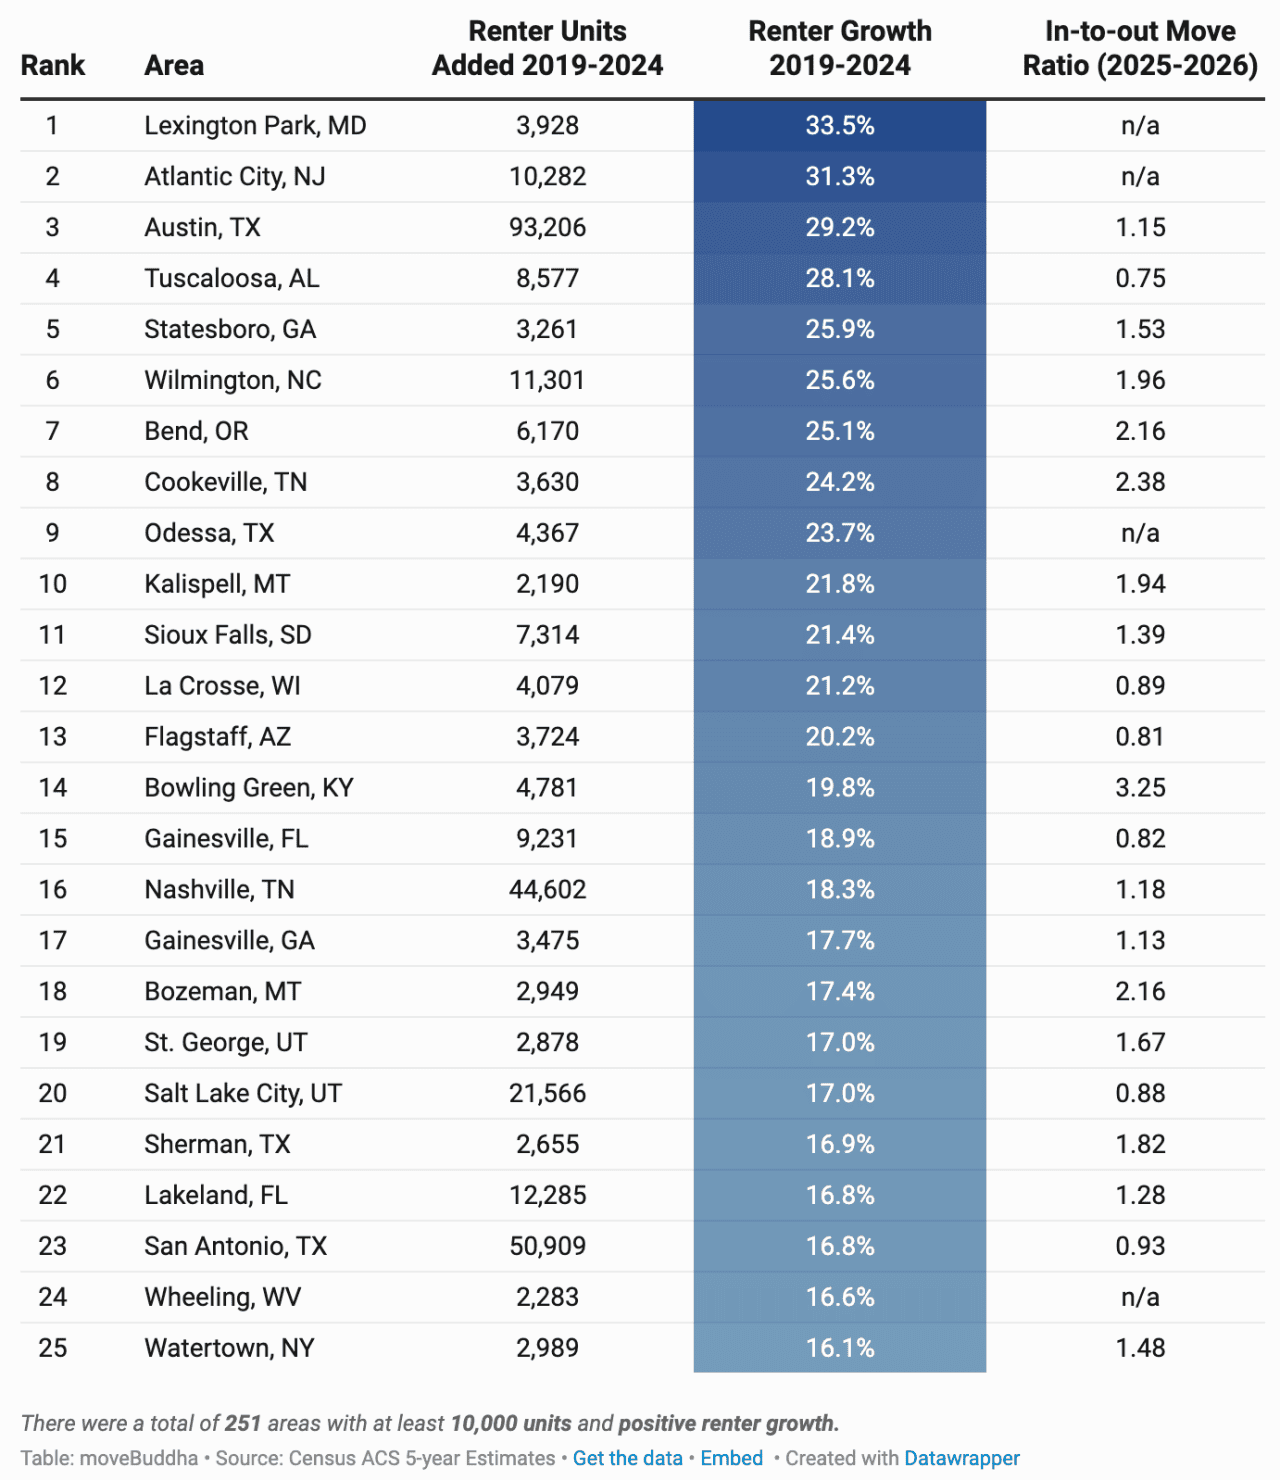
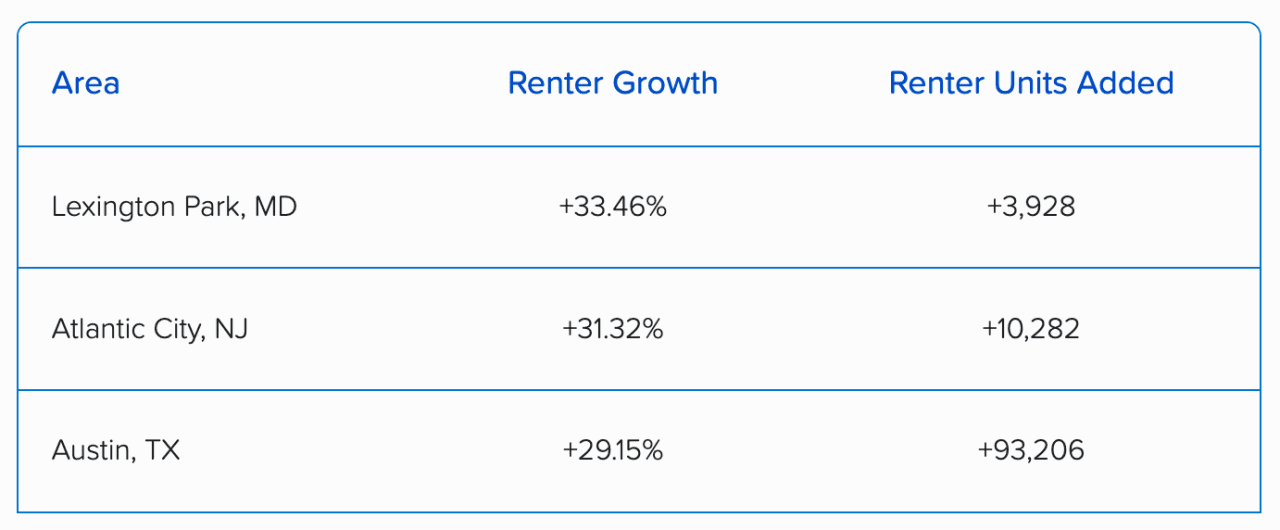
- The top renter-growth markets tell three stories: military churn in #1 Lexington Park, Maryland (+33.46%), tourism demand in #2 Atlantic City, New Jersey (+31.32%), and new construction in Austin, Texas (+29.15%).
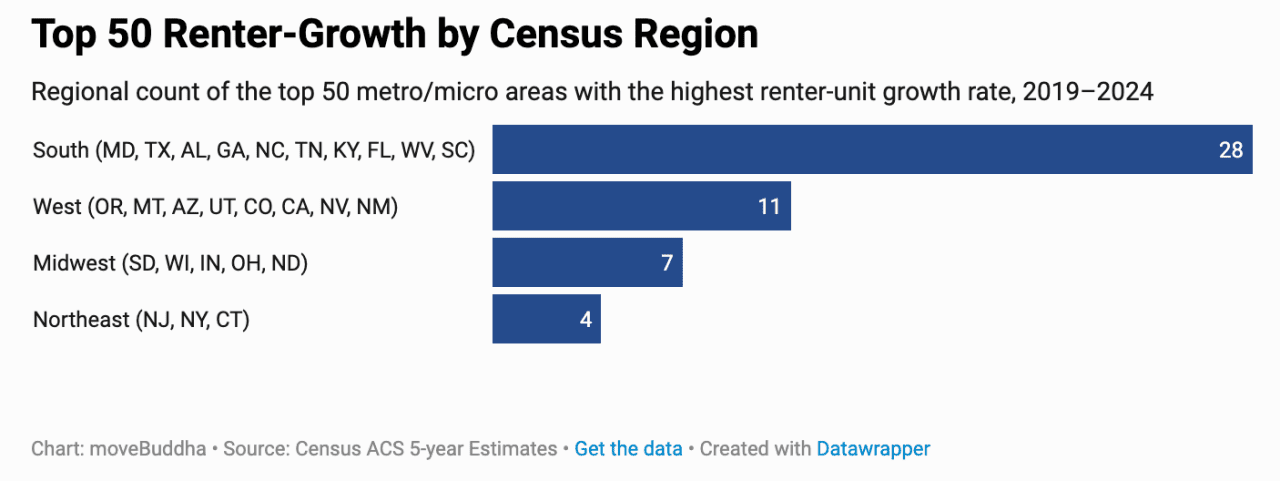
- The South dominates the fastest-growing renter markets with 28 of the top 50. Texas (10) and Florida (4) have the most markets in the top 50.
- 19 of the top 50 cities are college towns. Even when enrollment hasn’t increased at the same rate, these brainy locations saw renter occupancy rise, on average, 18%.
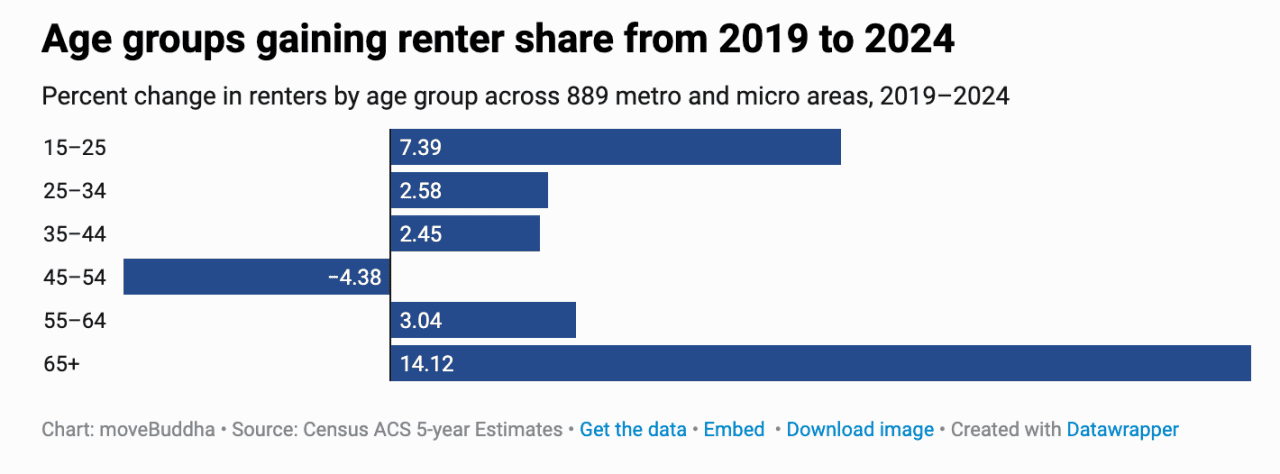
- The rise of retired renters: Renters aged 65 and older increased 14.12% from 2019 to 2024 across the 889 areas analyzed, the fastest growth of any age group.
moveBuddha
The Same Rental Boom, 3 Different Stories
The top three markets show why renter growth is not the same as a building boom: Lexington Park points to military churn, Atlantic City to tourism demand, and Austin to new supply.
To see why, first dispel the idea that “new rental units” is about cities that are building new housing.
Adding rental units is about the raw count of rental units occupied in a city. That includes new homes getting built and quickly occupied by renters. But it could also be that previously owner-occupied homes are converted to rentals, or that many more people move in, creating more renter households. And if an unsold property made you an “accidental” landlord? That’s also an “added rental unit” in this dataset.
Understanding that is key to seeing that in #1 Lexington Park (+31%), the rental surge doesn’t mean a building boom is underway.
Home to Naval Air Station Patuxent, Lexington is used to high residential turnover, hosting 20,000 military and civilian employees working in dozens of organizations. The shift in occupied rental units now suggests that even more people are moving in, in response to rising demand in the defense-oriented market.
In #2 Atlantic City, the renter-occupied units spike of 31% likely speaks to another reality: increased demand for rental housing around the tourism, convention, and casino economy. A building boom is unlikely, given the city approved just seven new housing units in 2024.
But in #3 Austin, a flurry of new construction might be the best explanation for the 29% increase: The city’s robust development has helped stabilize housing prices and increased supply, even amidst waves of in-migration interest. The metro added 93,206 renter-occupied units from 2019 to 2024, the largest numeric increase among the top 25 fastest-growing renter markets.
moveBuddha
The South Claims the Most Fast-Growing Rental Markets
Dominance of the South, 28 of the top 50 cities, points not to casinos or military bases, but to a larger Sun Belt narrative that’s sweeping multiple “types” of locations into the rental boom, from major job hubs in Texas like Austin and San Antonio/New Braunfels to smaller markets like Sherman, college-centered areas like Statesboro, Georgia, and fast-growing Florida metros like Lakeland.
moveBuddha
These Southern markets have attracted new movers and are likely increasing renter-occupied units through new construction or the filling of previous vacancies.
The common thread is migration, and it helps explain why the list includes a mix of cities without a common economic base connecting them.
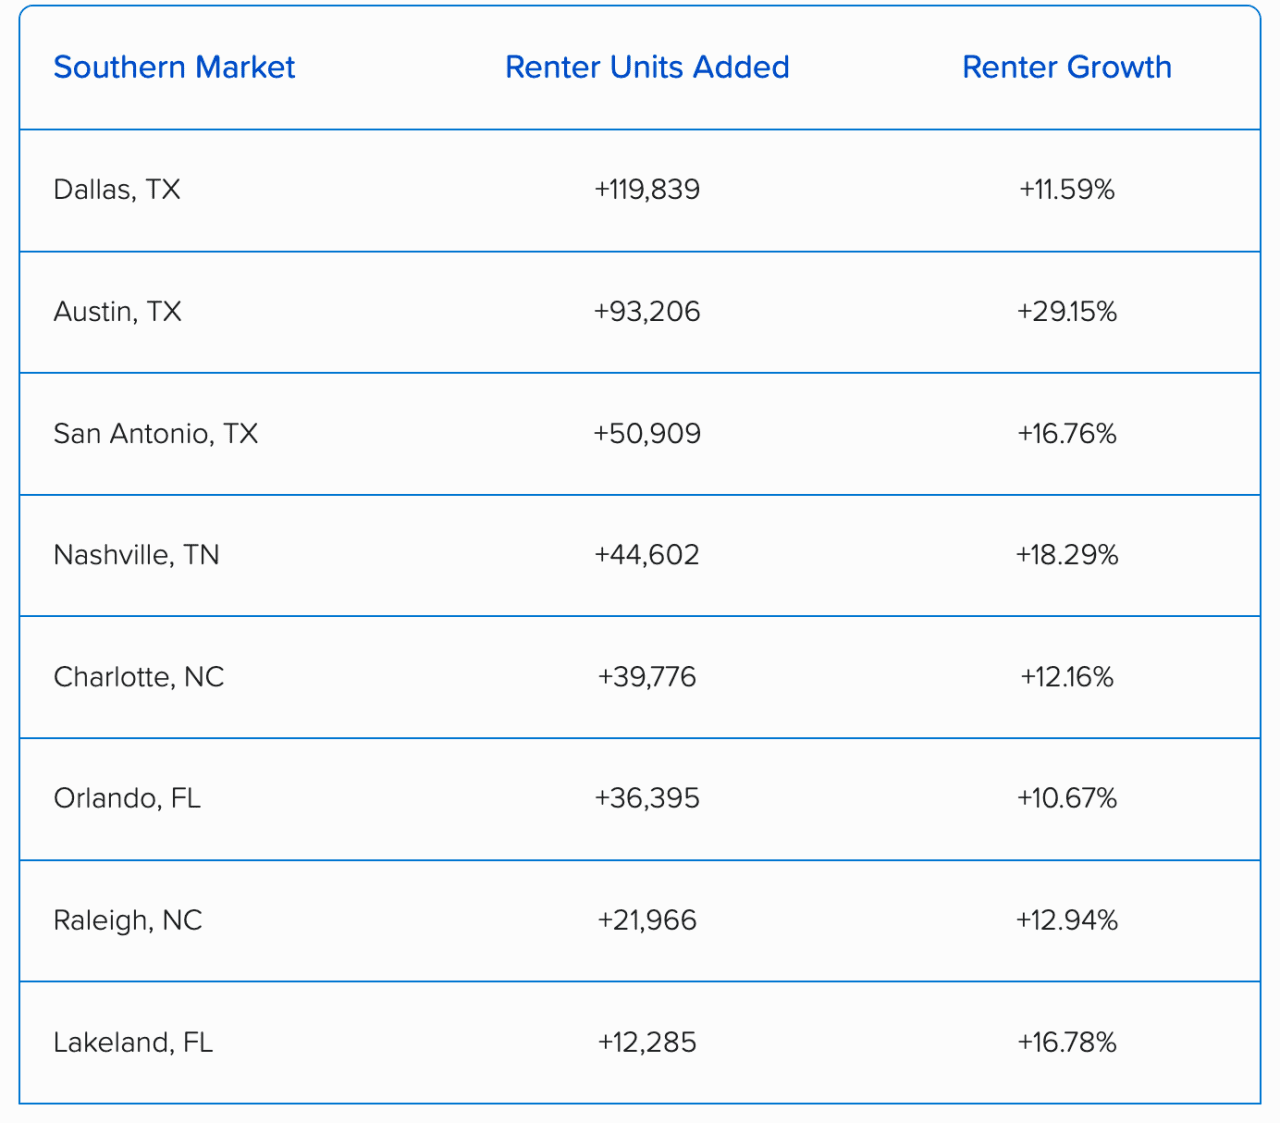
Southern markets are among those with the highest numeric growth in occupied-renter units:
moveBuddha
Dallas added the most renter-occupied units among the top 50 fastest-growing renter markets, while Austin stands out for ranking near the top by both percentage growth and raw unit growth.
Other Southern markets show how renter growth is spreading beyond the biggest metros.
For example:
- San Antonio, Texas, has added 50,909 renter-occupied units, and with New Braunfels included, the metro has added 254,751 new residents (about 1 new renter-occupied property per 5 new residents).
- Lakeland, Florida, added 12,285 renter-occupied households alongside 127,842 new residents (about 1 new unit per 10.1 new residents).
- Sherman, Texas, increased occupied rental units by 2,655 and added 14,940 residents (about 1 unit for every 5.6 newcomers).
Florida and Texas show how broad the pattern is: Rental growth here has spread from urban cores to college, retirement, logistics, and service hubs. The common thread? Just that they’re part of a region that’s been gaining people. And those people need to live somewhere, pulling rental growth southward, leaving the Northeast and Midwest behind.
So while renter growth is often treated as an affordability issue, from 2019 to 2024, its growth is centered around areas already considered “affordable” vis-à-vis U.S. averages (Lakeland’s current $312,001 average home price is still 15.26% less than the U.S. average of $368,198).
In recent years, renter-occupied growth has been more about migration than affordability alone.
The College-Town Rental Boom Is Bigger Than Students
Many university-centered areas are adding rental households at a pace that cannot be explained by student enrollment alone.
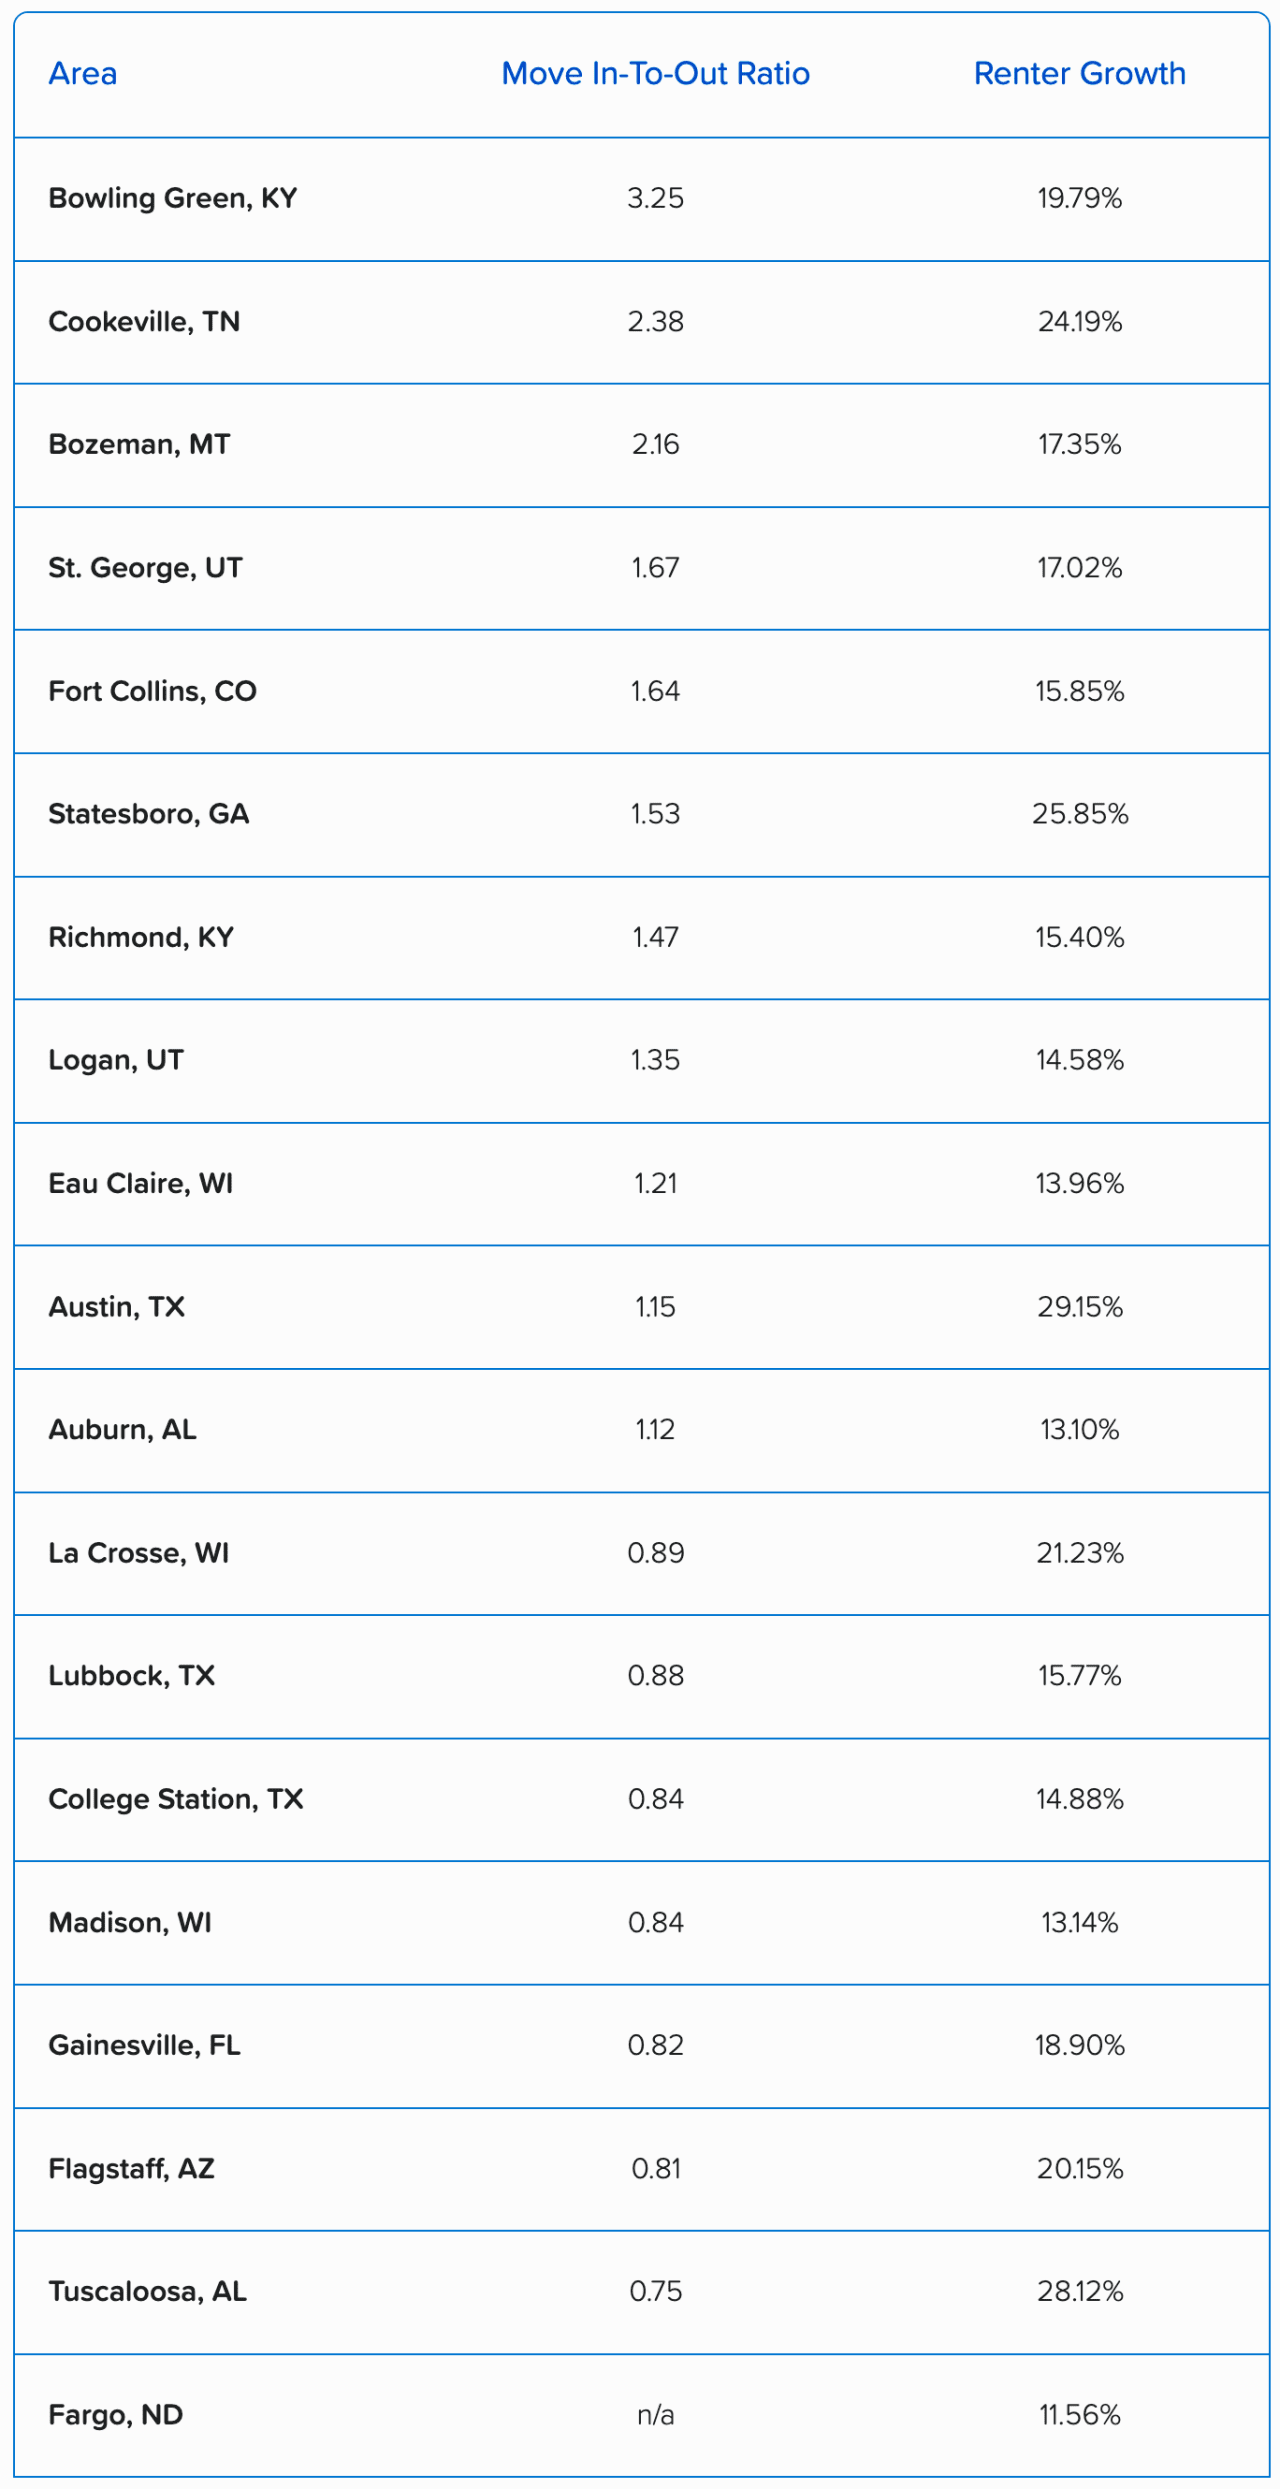
Nineteen of the top 50 fastest-growing renter markets are university-dominated places, from classically collegiate Madison, Wisconsin; College Station, Texas; or Auburn, Alabama, to more diversified economic hubs like Raleigh, North Carolina, or Fort Collins, Colorado. Ten rank in the top 25: #3 Austin, Texas, #4 Tuscaloosa, Alabama, #5 Statesboro, Georgia, #8 Cookeville, Tennessee, #12 La Crosse, Wisconsin, #13 Flagstaff, Arizona, #14 Bowling Green, Kentucky, #15 Gainesville, Florida, #18 Bozeman, Montana, and #19 St. George, Utah.
Universities are rental-normal. From frat house mansion rows to student apartments, these locations are dominated by the rotating course offerings of the academic calendar. That’s meant that they, historically, have rental-centered markets. But they’re increasing even more their renter-occupied units than what, say, their popularity for move-ins or enrollment would explain.
The pattern is clearest in places where renter growth and current move-in interest are both high.
- Bowling Green has the highest in-to-out move ratio among these college-centered markets, with 3.25 searches for moves in for every move out, plus a 19.79% increase in renter-occupied units from 2019 to 2024. However, Western Kentucky University student enrollment is falling.
- Cookeville, home to Tennessee Tech University, added 371 students from 2019 to 2024. But the city added 3,630 renter-occupied units. The micropolitan area added 8,600 new residents in that time frame, 1 for every 2.37 newcomers. It also earns 2.38 move-in searches for every move-out search.
- Bozeman, with a 2.16 in-to-out move ratio and a 17.35% increase in renter-occupied units, keeps drawing in new moves and students too.
moveBuddha
Eleven of the 19 college towns see a high number of searches for moves in versus out. Seven of them are getting more requests for move-outs than move-ins, likely reflecting the difference between a five-year renter-growth window and a newer 2025 to 2026 search snapshot.
Ownership consolidation may be at play. As housing is bought up in college towns, for student rentals or to be leased out for weekend visitors catching a football game, would-be buyers can find that the limited supply forces them to rent.
The Renter Boom Is Older Than You Think
It’s not always young grads landing in the rental markets of cities where they can’t afford to buy.
Renters aged 65 and older increased 14.12% from 2019 to 2024, the fastest growth of any age group across the 889 metro and micro areas analyzed. Renters aged 15–25 also rose, up 7.39%, reinforcing the college-town pattern.
moveBuddha
Together, the data show renter growth is being driven by both ends of the age spectrum: young and older movers.
If renting is a migratory story above an economic one, the fact that units are occupied by retirees is a story of the continued flow of seniors out of snowy climes, seeking shovel-free lifestyles without homeownership responsibilities.
America’s Renter Boom Is Moving South, Into College Towns, and Older
Recent Apartment List research frames renting as increasingly intentional. So it’s no surprise America’s rental market is growing, but not everywhere equally. Instead, niche economic hotspots, college towns, and all types of cities in the South (and a few in the Mountain West) are adding occupied rental units, though not always above and beyond the numbers of in-movers they’re seeing. Many are betting the current inflow will keep paying off.
And whereas America’s big coastal hubs used to be places where renting was the default option, over the past few years, that math has added up differently. Today, renter-occupied home growth is showing up where home values are nationally known as “affordable.”
Increasingly, renting is a map of population mobility itself, showing an America (and an older population) that’s spreading into smaller, cheaper metros, Sun Belt cities, and university towns.
Methodology
To identify where renter-occupied housing grew fastest, moveBuddha analyzed renter-occupied housing units across 889 U.S. metro and micro areas from 2019 to 2024, using U.S. Census ACS data. The final analysis looks only at areas with at least 10,000 units for each period to avoid skew from very small markets.
For each metro or micro area, researchers looked at:
- Renter-occupied units in 2019
- Renter-occupied units in 2024
- Numeric change from 2019 to 2024
- Percentage change from 2019 to 2024
Areas were ranked by percentage growth in renter-occupied units to highlight places where rental occupancy increased fastest from 2019 to 2024.
Additional context was included:
- moveBuddha moving-cost-calculator search data; as a measure of moves in divided by out, the move-in-to-out ratio. Data ranges from April 1, 2025, through March 27, 2026. 34 of the 251 areas in the closer analysis did not have sufficient data.
- Age-group renter growth, calculated across the same 889 metro and micro areas by comparing renter counts by age group from 2019 to 2024.
- Regional and state-level patterns, based on the number of metro and micro areas appearing among the top 50 fastest-growing renter-occupied markets.
This story was produced by moveBuddha and reviewed and distributed by Stacker.
![]()